Snapshot Wisconsin July 2021
This edition of the Snapshot newsletter is all about birds. With the completion of a bird-themed collaboration (discussed in the first article), it seemed appropriate to give some special attention to the birds that occasionally make an appearance on the trail camera images.
Read more about a unique bird-themed collaboration with the Wisconsin Breeding Bird Atlas II and a species highlight of a large, iconic Wisconsin bird, the sandhill crane, in this edition of the newsletter. Additionally, the Snapshot Wisconsin team is happy to announce that the 2020 data are now available to explore on the Snapshot Wisconsin Data Dashboard.
Snapshot Wisconsin Bird Edition: Using Snapshot’s Bird Photos In New
Ways
Learn how the Snapshot team has been working with the Wisconsin Breeding Bird Atlas II to use bird photos in a new way!
The 2020 Data Are Now Available On The Data Dashboard
The Snapshot Team is happy to announce that the data from 2020 are
now available on the Data Dashboard.
Highlighting Sandhill Cranes On The Data Dashboard
This species highlight focuses on an iconic Wisconsin species, the sandhill crane. The team explores what the Data Dashboard can tell us about the lives of these cranes. Jess Jaworski, fellow bird researcher at the DNR, shares her thoughts about this species and the dashboard.
SNAPSHOT WISCONSIN BIRD EDITION: USING SNAPSHOT'S BIRD PHOTOS IN NEW WAYS
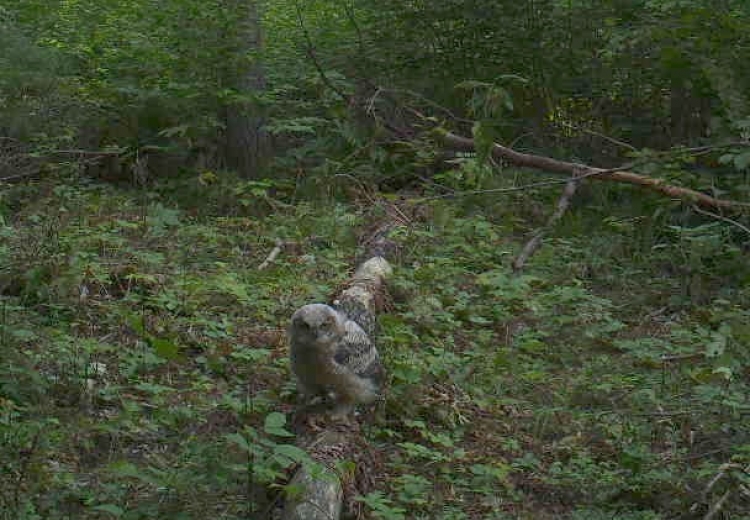
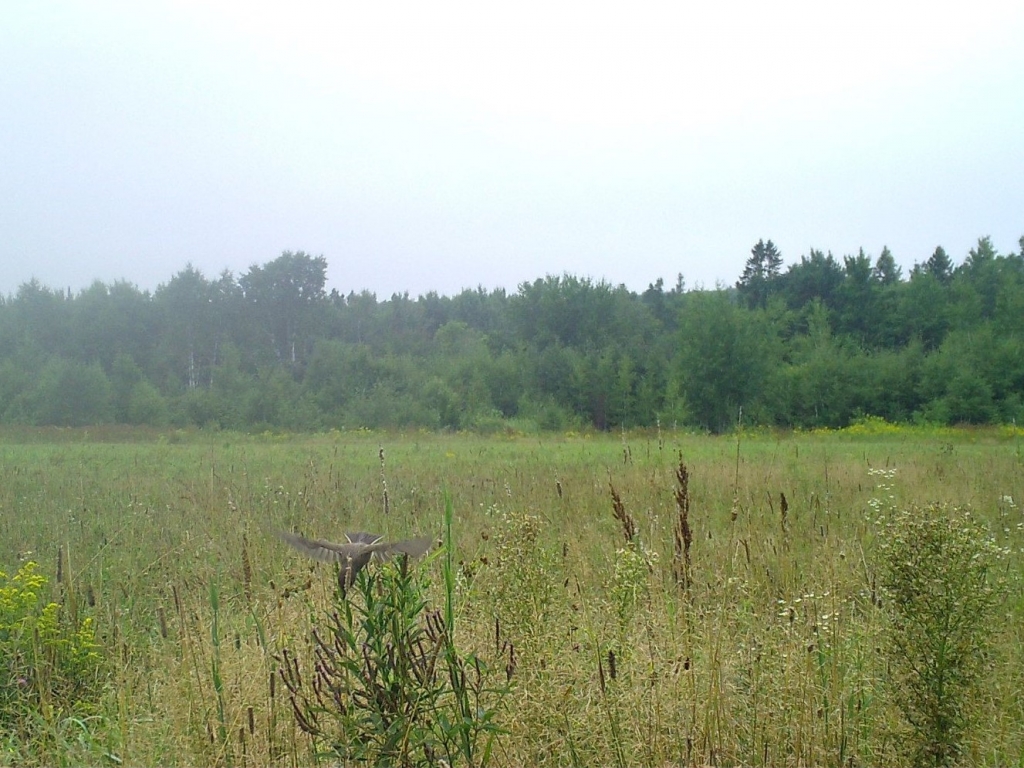
A male American woodcock stretches his wings skyward in a courtship display, a great-horned owl strikes an unknown target on the forest floor and a male northern cardinal duteously feeds his newly fledged young.
These are moments in the lives of birds captured by Snapshot Wisconsin trail camera photos. Until recently, however, many of these avian images were hidden within the Snapshot Wisconsin dataset, waiting to be uncovered by a team of bird enthusiasts. Unlike how they normally watch birds, from behind a pair of binoculars, this time they were behind a keyboard.
When Snapshot volunteers classify an image, they normally can choose from a list of around 40 wildlife species. Only five of these species are among Wisconsin’s 250 regular bird species: wild turkey, ruffed grouse, ring-necked pheasant, sandhill crane, and the endangered whooping crane. These five species are options on the list because they either are of special management interest within the Wisconsin DNR or are easier to detect by Snapshot Wisconsin cameras.
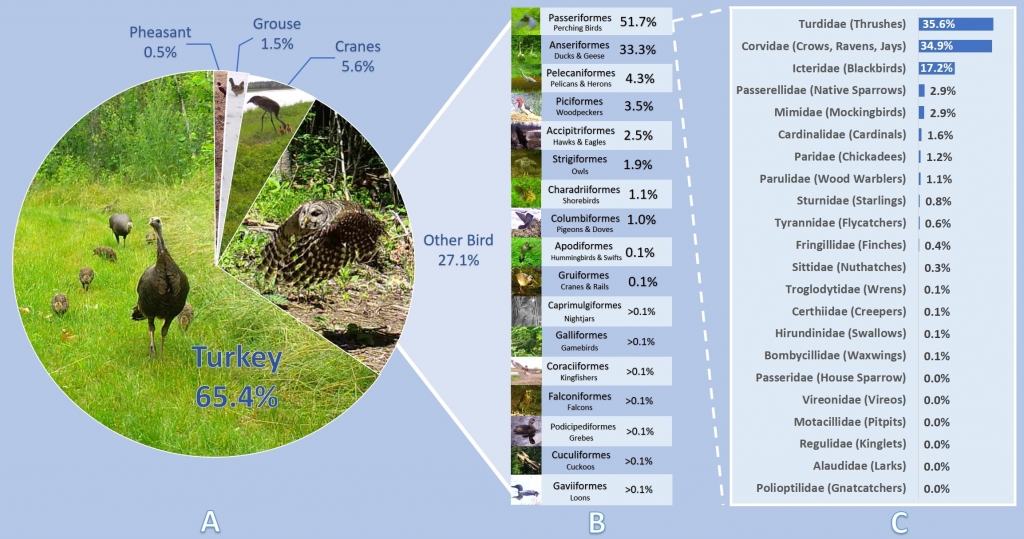
The rest of the bird photos are classified into a catchall group, called “Other Bird.” Until recently, the “Other Bird” images were considered incidental images, but the increasing size of this category caught the attention of the Snapshot Wisconsin team. In fact, “Other Bird” is the second most common classification of the six bird categories, only second to Wild Turkey (Figure 1, Panel A), which comprises over a quarter of all bird photos.
The team reached out to the Wisconsin DNR’s Bureau of Natural Heritage Conservation (NHC) to brainstorm ideas on how to leverage the “Other Bird” dataset, which had amassed 150,000 images at the time and was still growing.
Planting A Seed Of Collaboration
During their discussion with the NHC, the idea was brought up that these “Other Bird” images could contribute to the Wisconsin Breeding Bird Atlas II (WBBA II). The WBBA II is an enormous, multi-year field survey to document breeding birds and their distribution across the state. Information like the frequency of breeding and which areas birds are breeding in help the DNR see changes in breeding status for many bird species. This information can also be compared to data from the previous survey (from 1995 to 2000) and sets a benchmark for future comparisons as well.
The current survey uses data collected from between 2015 and 2019. Coincidentally, the earliest Snapshot images are from 2015 as well, so the dates of the survey aligned quite well. This collaboration seemed like a good fit.
However, there are some important differences between data collected from birding in the field and from images captured by Snapshot trail cameras. For example, many birds spend much of their time in the canopy, outside the camera’s field of view. Additionally, birders often use sound cues to identify signs of breeding in the field. Trail camera images do not contain these types of breeding cues. Lastly, certain breeding behaviors can be too fleeting to observe from a set of three images.
The team wasn’t sure yet if the trail camera photos would truly contribute much to the WBBA II.
A Collaboration Was Born
Members of the Snapshot Wisconsin and NHC teams ran a test of the “Other Bird” photos. They reviewed a small, random subset of images and learned that many of the birds could be identified down to the species level. The teams also found enough evidence of breeding, such as sightings in a suitable habitat (for breeding) or the presence of recently fledged young. Both teams decided to go ahead with the collaboration and see what they could find.
The full dataset was sent to a special iteration of Zooniverse, called the Snapshot Wisconsin Bird Edition, and birders began classifying. All of the “Other Bird” images were classified down to the species level, as well as assigning a breeding code to each image. In just over a year, the large collection of bird photos was classified, thanks to some dedicated volunteers.
The NHC’s Breeding Bird Atlas Coordinator, Nicholas Anich, extracted these new records and added them to the WBBA II. The atlas utilizes a statewide survey block system that is based on a preexisting grid from the United States Geological Survey. The survey block system requires that certain blocks be thoroughly surveyed in order for the atlas to have adequate statewide coverage, and many of the new Snapshot data points contributed to these priority survey blocks. Anich said, “[The Snapshot data] will be valuable information for the WBBA II, and we even discovered a few big surprise species, [such as] Spruce Grouse, Western Kingbird, and Whooping Cranes.”
In addition to these rare species, many of the high-value classifications were what Anich described as breeding code “upgrades.” The observed species already had been recorded in a given block, but the photos showed stronger evidence of breeding than had previously been reported. For example, an adult of a given species may have already been spotted in the area during the breeding season, but a photo showed a courtship display. The courtship display is stronger proof of breeding in the area than a single adult sighting.
How Useful Were the Snapshot Photos?
Both the (in-person) birding efforts and the trail camera photos picked up species that the other did not, so both approaches brought different strengths to the table.
One of the strengths of the trail cameras was that they are round-the-clock observers, able to pick up certain species that the in-person birding efforts missed. Anich said he noticed that nocturnal species (American Woodcock and Barred Owl) and galliforms (Wild Turkey, Ruffed Grouse) were more common in the Snapshot dataset than reported by the birders in the field, in certain areas at least. “Running into gamebirds was a bit the luck of the draw,” Anich said.
Both Anich and the Snapshot team agreed that the trail cameras were best used in conjunction with in-person surveys, rather than a substitute for each other because they each observed a different collection of species.
Insights Into The “Other Bird” Category
As a bonus for anyone who is interested in this project, the Snapshot team analyzed the photos classified for the WBBA II and created an infographic of the orders and families included. The photos included were captured between 2015 and 2019.
An immediate trend the team saw was that many of the birds were from species with larger body sizes, ground-dwelling species and species that spend time near or on the ground. For example, Anseriformes (ducks and geese) and Pelecaniformes (herons and pelicans) are the second and third most common order in the “Other Bird” category. The next most observed groups include woodpeckers, hawks, eagles, owls and shorebirds. While these birds may not spend all of their time near the ground, food sources for these species are often found in the stratum, an area where most trail cameras are oriented.
It was interesting that the most common order (comprising over half of the “Other Bird” classifications) was from the bird order Passeriformes (perching birds or songbirds). This order does not initially appear to fit the trend of ground-dwelling or larger-bodied birds. However, closer inspection revealed that the most common families in this order did fit the trend. For example, Turdidae (thrushes, especially American Robins), Corvidae (crows, ravens and jays) and Icteridae (blackbirds and grackles) comprised much higher percentage of the photos than any other families.
Thanks To Everyone Who Helped Classify Bird Photos On Zooniverse!
Overall, the Snapshot Wisconsin Bird Edition project was a huge success. In total, 154 distinct bird species were identified by nearly 200 volunteers, and over 194,000 classifications were made. The Snapshot Wisconsin and WBBA II teams extend a huge thank you to the Zooniverse volunteers who contributed their time and expertise to this project. The team was happy to see such strong support from the Wisconsin birding community, as well as from around the globe.
If you weren’t able to help with this special project, stay tuned for other unique opportunities to get involved as Snapshot continues to grow and use its data in new ways. If you contributed to the project, reach out to the Snapshot team and let them know what your favorite species to classify was.
THE 2020 DATA ARE NOW AVAILABLE ON THE DATA DASHBOARD
The Snapshot Team is happy to announce that the data from 2020 are now available on the Data Dashboard. Explore the 2020 dataset yourself today!
Snapshot’s Data Dashboard is a data visualization tool that lets the public interact with the data collected from over 2,000 trail cameras spread across the state. The Data Dashboard first was made available to the public in October 2020 and showcased the data of 18 species. Since then, an additional species have been added to the list, and the Snapshot Team plans to add more over time.
One of the unique features of the dashboard is that it lets people choose which data they want to visualize. You can look at data from individual years by selecting the desired date range on the slider along the left side of the dashboard. Four distinct years (2017-2020) are available to peruse. When a new date range is selected, the map of Wisconsin will update and show only the data for the selected dates, allowing anyone to see trends over time.
Check out the 2020 data on Snapshot Wisconsin’s Data Dashboard:
https://widnr-snapshotwisconsin.shinyapps.io/DataDashboard
HIGHLIGHTING SANDHILL CRANES ON THE DATA DASHBOARD
Continuing with the bird theme, the Snapshot Team wanted to highlight one of the five specific species that can be chosen while classifying photos: the sandhill crane. At the same time, the team wanted to use the new 2020 data on the Data Dashboard, so they decided to do both!
The team invited fellow DNR researcher, Jess Jaworski, Assistant Waterfowl Research Scientist within the Office of Applied Science, to look through the sandhill crane data on the Data Dashboard. Jaworski is currently working on waterfowl research, but she previously worked with cranes.
Jaworski’s graduate research involved studying the nesting behaviors of cranes in Wisconsin. “My graduate research was focused on the nest success of the reintroduced whooping crane population at the Necedah National Wildlife Refuge. The majority of my work was monitoring incubation behaviors of both whooping cranes and sandhill cranes under duress of an avian-specific black fly. This fly caused a wide-spread and synchronous abandonment of nests.” Jaworski put up several trail cameras at nests and went through thousands of photos to monitor behaviors at those nests; Not that different from what Snapshot Wisconsin does.
A Bit Of Background On Sandhill Cranes
Before we dive in, let’s make sure everyone knows a bit about sandhill cranes. Jaworski was happy to share her knowledge of sandhill crane behavior.
Wisconsin’s sandhill cranes are part of the Eastern population of migratory sandhill cranes, and there are over 70,000 individuals in this population. As implied by the term “migratory,” they don’t spend the entire year in Wisconsin. Jaworski explained that these birds spend the winter down South. Around mid-March, they come back north to their breeding grounds and establish pair bonds.
Sandhill cranes are typically a monogamous species, so they will find a mate and pair off if they don’t already have one. “They usually try to find a pair bond within up to two years of birth, and they start nesting at three to six years in open marsh wetlands, although sandhill cranes can nest in a wide variety of habitats. They hopefully will hatch within a 28-day incubation period and fledge their young within two to three months. Once that is done [usually in September/October], they migrate back to their wintering grounds.” Come the next March, they start the cycle over again.
Diving In To The Data Dashboard
Jaworski was curious how well the trail camera data would match the description she gave above. The team sat down with her to see. At first glance, Jaworski said the data seemed pretty consistent with what she knows about their behaviors and where cameras were located around the state.
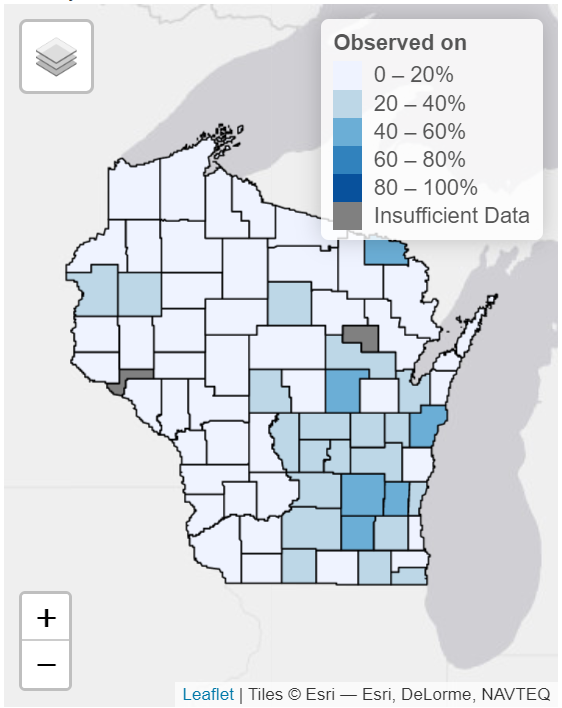
Take the map of detections by county, for example. Jaworski pointed out a higher percentage of crane detections in the southeast quadrant of the state. “That is consistent with their habitat [preferences]. They typically nest in open marshes, and the map matches where I know wetlands exist in the state,” said Jaworski. “Dodge County has cranes in the Horicon Wetland Area, for example. To the northwest, there are more cameras picking up these birds, potentially from the Crex Meadow Area. There is a large amount of birds in Adams County nearby to Juneau County where birds nest at the Necedah National Wildlife Refuge, which is where I did my graduate work.”
Jaworski also looked at detections by the ecological landscape, a clickable option to the left of the map. Instead of counties, the map is blocked out into 16 regions with unique ecological attributes and management opportunities. “Generally, the southern and eastern sections of the state have more open, wetland areas, so I’m not surprised there are more detections in those areas. There are also a lot of agricultural fields here too,” said Jaworski.
“Sandhill cranes can adapt easily to human-made landscapes like agricultural fields, and it isn’t uncommon to see them nesting in smaller wetlands near agricultural fields, for example. If there are a lot of cameras in these areas, then there will be more sightings of sandhill crane.” In contrast, the northern part of the state tends to be more forested land, so the southeast is the ideal habitat for a crane looking to build a nest.
Activity By Month And Hour Of The Day
So far, the detection locations matched what Jaworski expected to see, but one of the more interesting features of the dashboard is the breakdown of detections by month and by hour of the day. How well would the data hold up?
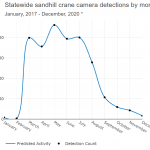
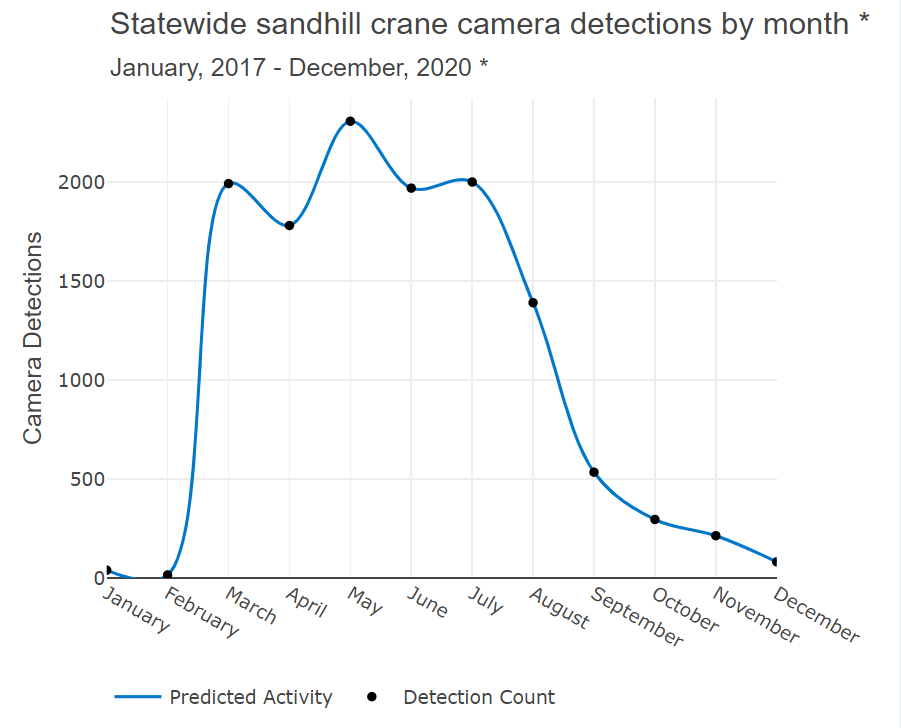
Jaworski started with the month data and immediately zeroed in on the lull in detections during the winter months. “This is exactly what I’d expect to see,” said Jaworski. “These migratory cranes are down south in their winter grounds [during these months]. When you get to March and April, I see a heightened activity pattern from cranes migrating back and nesting. Then, there is a lull again later in the year, as they start migrating back south.”
Jaworski also noticed that the migration south occurs over a much longer period of time than the migration back, as seen by a more gradual decline in detections in September and October. “That could be a product of different nest initiation times or different successes/failures throughout the nesting period. If birds nested earlier, then they will have fledged their young earlier than others and potentially leave the state sooner.” Alternatively, pairs who failed to successfully rear a fledgling may start over again if there is time. These pairs wouldn’t be able to migrate as early as pairs who succeeded on their first try, and that may lead to more detections later in the year.
The Snapshot team discussed how the placement of cameras also can influence the detection of species like the sandhill crane. Not all species spend their time in areas that are easy for trail cameras to watch. Not many Snapshot cameras overlook the center of a lake or marsh, which can lead to biases in detections for certain species.
However, Jaworski did confirm that cameras set up near-ideal nesting habitats will be much more likely to detect cranes. Cranes can be seen while they are up and about from their nests, looking for food, or when adults swap who is incubating their nest.
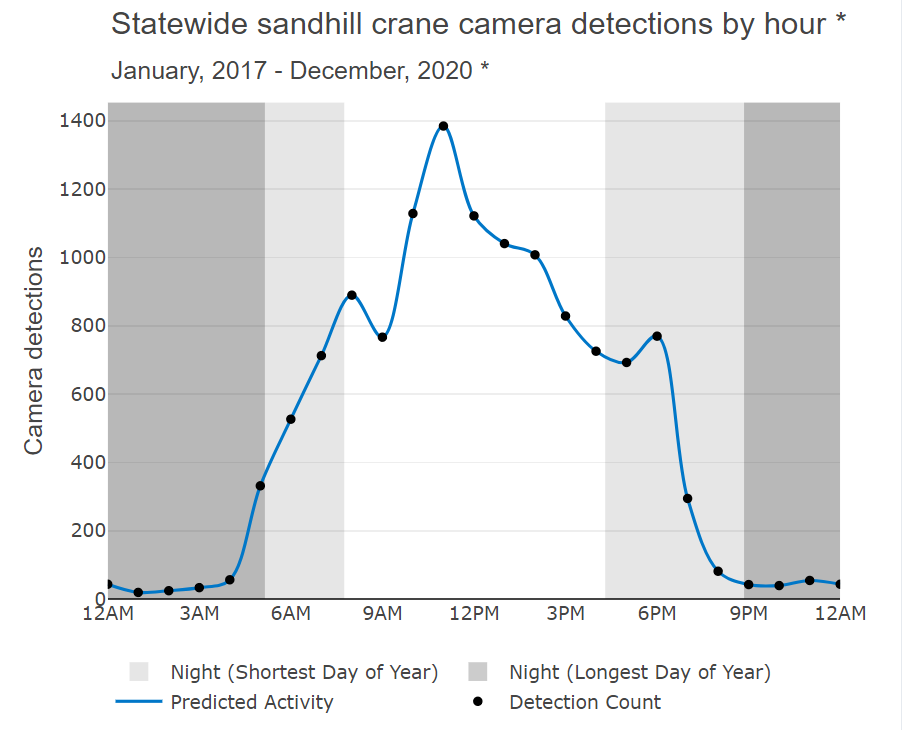
Jaworski also looked at sandhill crane activity throughout the day. “In the morning hours, they will leave their roosting areas. When pairs are forming pair bonds, they will do dawn unison calls. You can often hear them in the early morning hours, [and the calls are quite distinct]. Throughout the day, they are probably feeding and moving about the wetland, so detections are more common then. In the evening, they return to their roosting site for the night.”
All in all, there were pretty clear patterns in the activity graph, and those patterns match what Jaworski expected to see. There is a small amount of variation between the hours of the daytime, but Jaworski didn’t think those peaks and valleys represented any meaningful behaviors for sandhill cranes. Jaworski said, “It is hard to determine fine-tuned patterns throughout the day. It could simply be from a bias in where the cameras are placed.”
The 2020 Data Are Accurate And Consistent
Jaworski and the Snapshot team adjusted the date slider in the left-most column of the dashboard to look at only the 2020 data. The 2020 data showed all of the same patterns that we’ve already mentioned and is consistent with what we know about where cranes are distributed across the state. “It shows that there is nothing unusual about this past year that indicated sandhill cranes are moving from their range or aren’t where you would normally see them occur,” said Jaworski.
Jaworski played around with the date slider some more and looked at each of the other years’ data individually. She noticed that the number of detections increased each year, starting from 2017. “It is really cool that detections are increasing. It says that interest in the program is also increasing,” said Jaworski. “Snapshot’s expansion each year provides more information about where these birds are located. Each year, you will find more detections, which helps inform research for this species. I also really like that there is a record of that data so that we can go back and analyze it if any questions arise in future studies.”
Jaworski’s Parting Thoughts
Before everyone parted ways, Jaworski shared some final thoughts with the team about the program and its impact.
It’s wonderful that a program like Snapshot exists. If somebody is interested in knowing what is going on with a particular species, it is awesome that Snapshot allows people to find that information through the Data Dashboard. It is a great opportunity for people to get involved.
Additionally, that type of cooperation between researchers and those who aren’t in research is invaluable and helps inform [our] research. Its great from a research perspective and a curiosity perspective when we collaborate.
Plus, getting involved [in citizen science] can spark an interest in a science career! A lot of us in research didn’t initially start out that way. Many of us started out as citizens who observed something interesting or maybe as kids who tagged along with our parents while they were doing outdoor activities. Looking at species or finding out what a scientist did inspired us.
My family comes from a natural resource background. My dad started out as a forester, and my mom worked as a park ranger and a boating officer in New Mexico. I tagged along with my mom quite often when she was giving presentations at the nature center. We were outside recreating a lot, camping and fishing. It had a big influence on my life and my career choice.
~ Jaworski
Jaworski encouraged more people to check out the Data Dashboard and learn something new about one of the species available. The Snapshot team suggests looking at the data in a similar way to how Jaworski did, piece by piece and thinking about what a species might be up to in different areas and at different times. It is a great way to think about the lives of these species. Plus, with the addition of the 2020 data, there is more data than ever to look at.

