FIELD NOTES SEPTEMBER 2024
DEER MOVEMENT, INTERACTIONS, AND CHRONIC WASTING DISEASE
Want to get notified when new newsletters come out? Sign up for the following topics on GovDelivery.
- Chronic Wasting Disease Updates - For emails about new project newsletters.
- Wisconsin Deer Research - For email updates on all deer projects being done by the Office of Applied Science.
For more Field Notes newsletters, please see the Field Notes Newsletter Index.
Our collaring of over 1,200 animals for the Southwest Wisconsin CWD, Deer and Predator Study (SW WI CWD Study) has given us insight into the lives of deer, coyotes and bobcats in southwest Wisconsin. GPS collar data is extremely useful for the additional analyses we had planned to conduct from this massive dataset we now have. We’ve already covered in prior newsletter editions what we have learned so far, including how the landscape impacts juvenile male dispersal, buck movement rates during the breeding season, and how these could impact chronic wasting disease surveillance and management.
This edition of Field Notes will be of interest to hunters prepping for fall hunts: videos of deer movement and interactions during peak rut. We’ll begin with an overview of 11 deer in a small section of the study area. Then, we’ll dive into individual bucks from that same area, looking at the interactions between two mature bucks, and the disjointed seasonal home range of one of those bucks.
Deer Interactions During The Rut
We'll start with a bird's eye view of a subsection of the SW WI CWD Study area, following seven bucks and four does that were collared there. That's a lot of GPS points to track, but if we look carefully, quite a few interesting patterns and behaviors can be seen.
Buck Interactions: Buck A vs. Buck B
Now, we'll look into two bucks from our study subsection. Collar 40440 (Buck A) and Collar 29536 (Buck B) are both mature bucks that were very familiar with each other in a 36-hour period during the second week of peak rut. We condensed those 36 hours into a 50-second video and then break it down using screenshots of notable events.
Seasonal Home Range: Collar 29536
Collar 29536, or Buck B as we called him in the previous article, also provided researchers with an interesting example of a buck with distinct seasonal home ranges. Watch this buck's movements from March 2020 until November 2021.
Tip of the Iceberg
Why is movement ecology important for chronic wasting disease research and what have we found so far? The power of this research, and the impacts on deer and CWD management, is just getting started.
DEER INTERACTIONS DURING PEAK RUT
Let’s start with a birds-eye view of a small portion of the Southwest Wisconsin CWD, Deer and Predator study area. In this 3.5 square-mile subsection there were 7 bucks and 4 does monitored with GPS collars during the 2020 rut—reminder that this is just the deer that we collared here and the actual number of deer in this area is probably much larger. However, having 11 collared deer in a single area at the same time allows to make insights regarding deer interactions during the breeding season.
Research has shown that peak rut in this area occurs over roughly a three-week period between October 23 – November 12, as detailed by Matthew Hunsaker in the December 2023 newsletter. The video below covers the first week of the 2020 peak rut (October 23-November 1).
In this video:
- During the rut, buck collars were programmed to collect a location every hour. Doe collars recorded a point every four hours.
- Dark red, light red, pink, and purple circles indicate four unique mature bucks that were at least 3.5 years old.
- Orange indicates a 2.5-year-old buck.
- Dark and light yellow indicates two 1.5-year-old bucks.
- Diamond shapes in shades of green or blue indicate does, but do not differentiate by age.
While at first glance it’s a confusing swirl of zig-zagging tracks, if we look carefully quite a few interesting patterns and behaviors emerge. It may take a couple of viewings before you see some of these patterns, but here are a few that we see:
- Crepuscular movements.
Deer are crepuscular, meaning they are most active at dawn and dusk. This is visible in the video as alternating patterns of tightly clustered locations and longer movements.
- Increased movement rate during the rut.
During the peak of the rut, bucks can be on the move at all hours of the day and will be on the move for extended periods of time seemingly without rest. This explains why bucks can come out of the rut in poor condition and lead to lower over-winter survival.
- Different movement patterns.
In the December 2023 newsletter, we looked at how buck movement rates differed by age, which could reflect their breeding strategies and success. Can you see differences between individual buck’s movement patterns? Clusters of buck points in a small area, particularly during dawn/dusk hours when deer are most likely to be on the move, could indicate tending behavior when a buck is following a doe in estrous.
- Interactions between collared individuals.
Do you see certain individuals spending more time with each other, such as a buck following a doe? Do you see any interactions between bucks, which might suggest competition for breeding opportunities? Even among just these 11 deer we can see multiple interactions with each other; imagine this on a larger scale with all the deer in this area.
BUCK INTERACTIONS: BUCK A VS. BUCK B
Now, we’ll look at how two bucks from within the same 3.5-mile area shown above interacted over the course of a 36-hour period (roughly November 11-13, 2020). Collar 40440 (Buck A) and Collar 29536 (Buck B) are both mature bucks and the time range in the following video and accompanying screenshots is within the second week of peak rut in southwest Wisconsin.
COLLAR 40440 (Buck A, blue circles)
4.5 Years Old
CWD Status at time of capture: Negative
COLLAR 29536 (Buck B, pink circles)
3.5 Years Old
CWD Status at time of capture: Negative
This video is 36 hours condensed down into 50 seconds, with a lot of action captured since the bucks’ collars were collecting locations every hour during this time of year. Circles indicate the hourly location while the line between circles help track the general path taken. The screenshots below the video provide a breakdown of notable points from the video so you can look for specific movement and interactions between Buck A and Buck B.
Screenshots
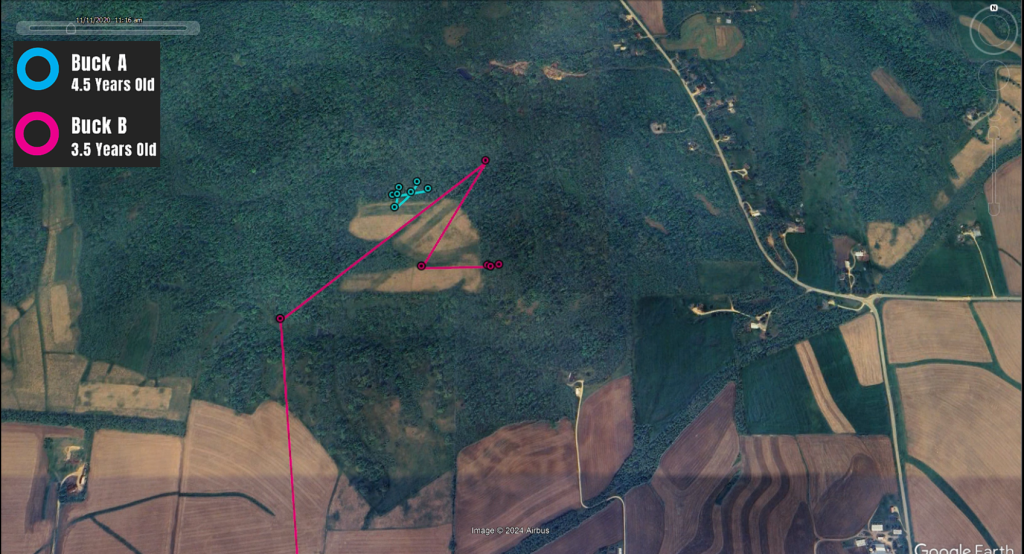
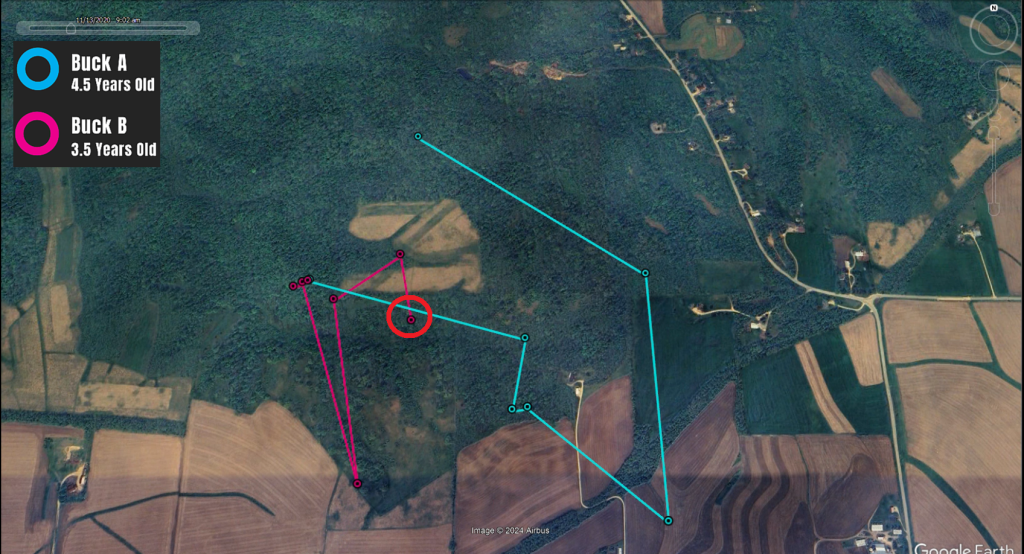
Timestamp 00:02 - Buck A (Blue Circles - 4.5 year old) has been staying within a very small area near the edge of food plot for approximately 15 hours, spending most of the day into the evening in this area probably tending a doe. We can tell by the tight cluster of his location points, with an hour in between each circle—Buck A during this time is taking “short steps” or not moving very far every hour. You’ll soon see the difference in the next set of screenshots.
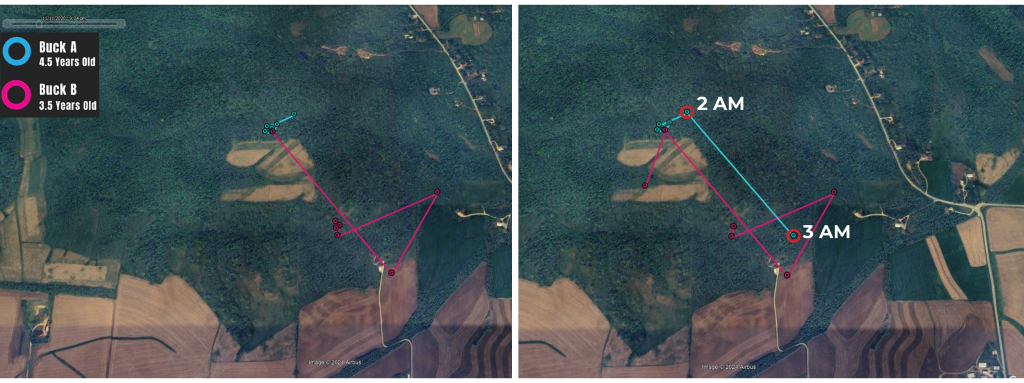
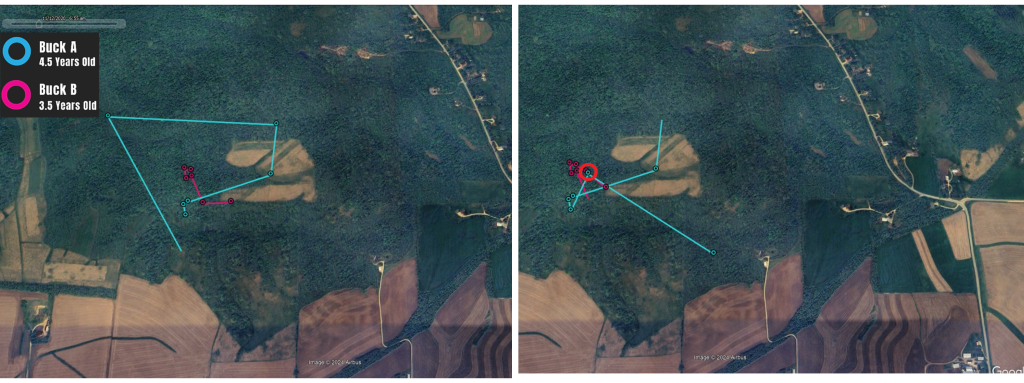
Timestamps 00:11-00:12 - Around 2 a.m. on November 12 (00:11 screenshot, left), Buck A begins to move away from this area at about the same time that Buck B (Pink Circles - 3.5 Year Old) arrives. The distance between Buck A's 2 a.m. and 3 a.m. point is almost a half mile, a much larger distance than what he had been making (00:12 screenshot, right).
When considered in the context of Buck A’s previous tightly clustered points in the first screenshot, and the simultaneous and sudden arrival of Buck B into the area, this large movement away from his previous cluster of point suggests that an interaction may have occurred between the two bucks and Buck A decided to leave the area. While we can’t know for sure what transpired, an interpretation could be that Buck B had been attracted to the area by the presence of an (uncollared) doe approaching estrous, possibly one that Buck A was tending. Despite possibly being pushed away by Buck B, Buck A stays very interested in this area, and will make several return trips to this small field.
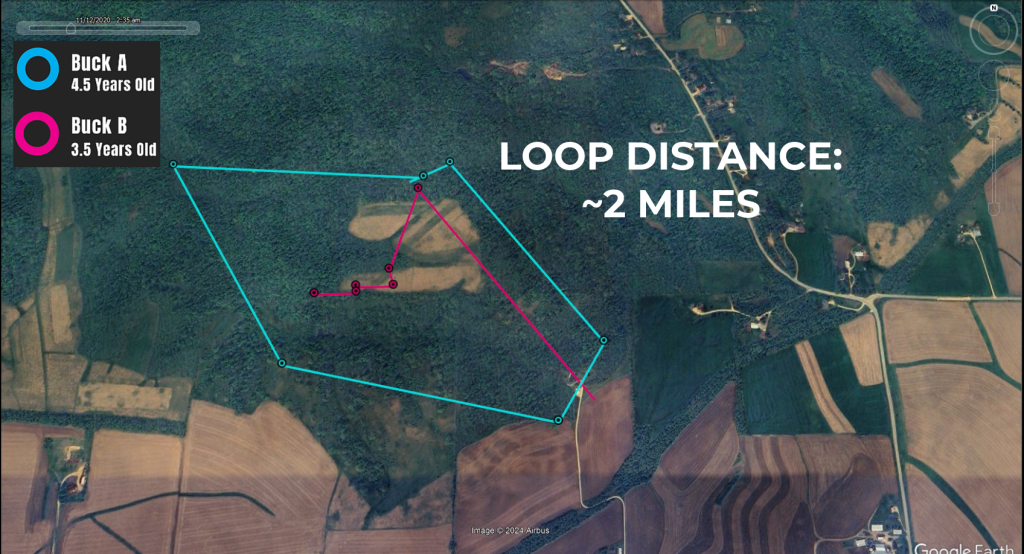
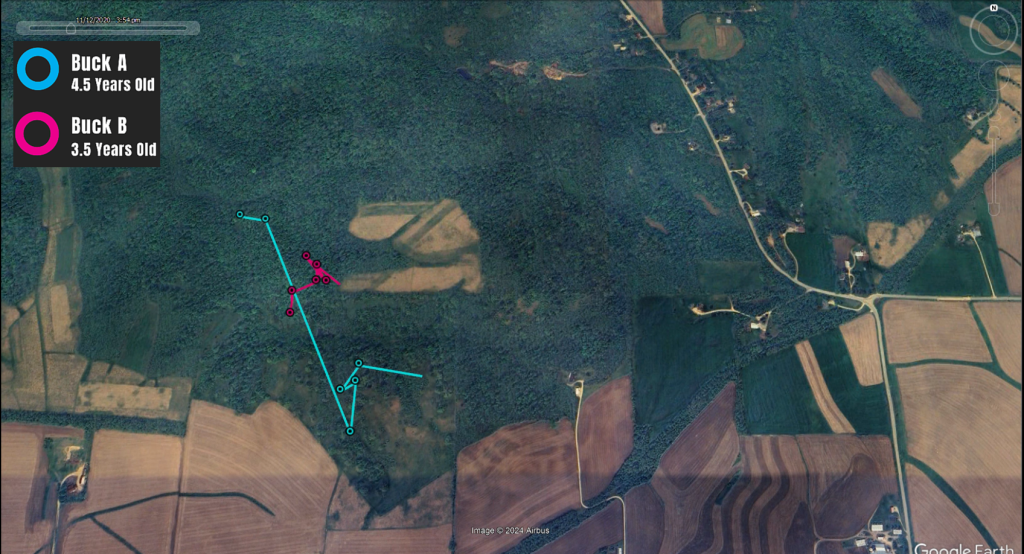
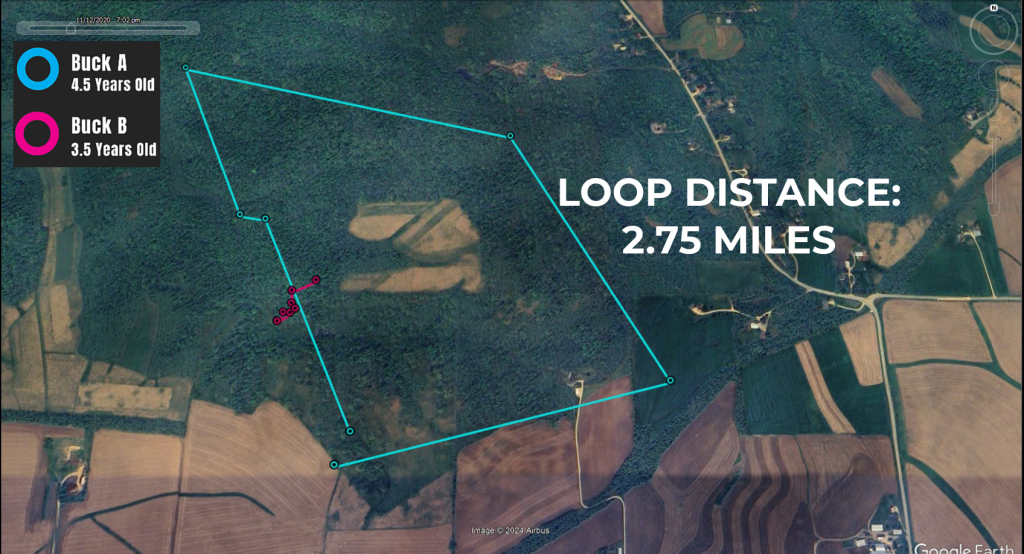
Timestamp 00:15 - Buck A spends the rest of the early morning making a large loop around the field (total straight-line distance between these points was just over two miles) and has arrived at the exact same spot by 7 a.m. He spent roughly five hours traveling this loop. During that time, Buck B has been making much shorter steps across and along the field edges. Perhaps Buck B has now began tending a (presumed) estrous doe as they amble around the field feeding, while Buck A was circumnavigating the area.
Timestamp 00:17 - Around 9 a.m., Buck A took a similar path across the field that Buck B did 4-5 hours previously.
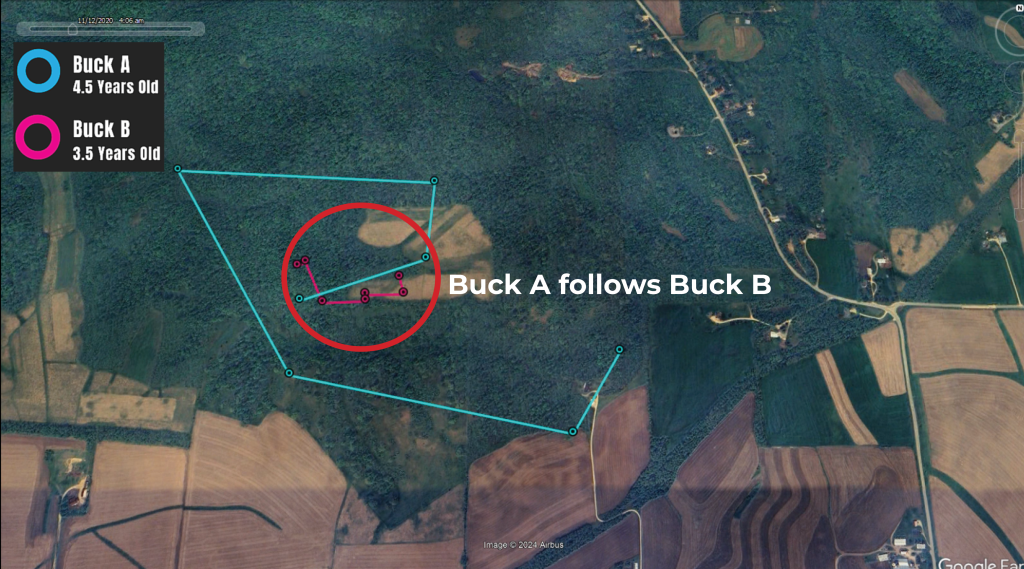
Timestamp 00:20-00:22 - After slowing down for a few hours, perhaps even taking a brief rest (judging by the short steps lengths between Buck A’s 9-11 a.m. points), Buck A and Buck B are once again close to each other (00:20 screenshot, left). This is the second time in 10 hours that these two bucks are in immediate vicinity, and a similar pattern is going to repeat. Around 12 p.m., Buck A encounters Buck B (red circle in 00:22 screenshot, right). Buck A suddenly leaves the area after the encounter and moved approximately 650 meters (~.4 mile) between 12 p.m. and 1 p.m. Is this an instance of Buck A trying to steal the doe away from Buck B before being chased away?
Timestamp 00:23-00:27 Buck A then spent most of the afternoon on the move after his encounter with Buck B. Between 6-7 p.m. he made a longer movement, which intersects exactly with Buck B’s 7 p.m. location. We can't know if they interacted for a third time, but they would have been in the same area within minutes of each other, so it’s possible. Buck A still seems interested in that area on the southwestern corner of the field.
Timestamp 00:32 - It is now 12 a.m. on November 13 and Buck A has just completed another circuit of the entire area. Buck A had spent the evening of Nov 12 traveling the loop, this time the straight-line distance is ~2.75 miles. This is the second time in 24 hours he has traversed this circuit. He's essentially been on the move for 24 hours straight at this point.
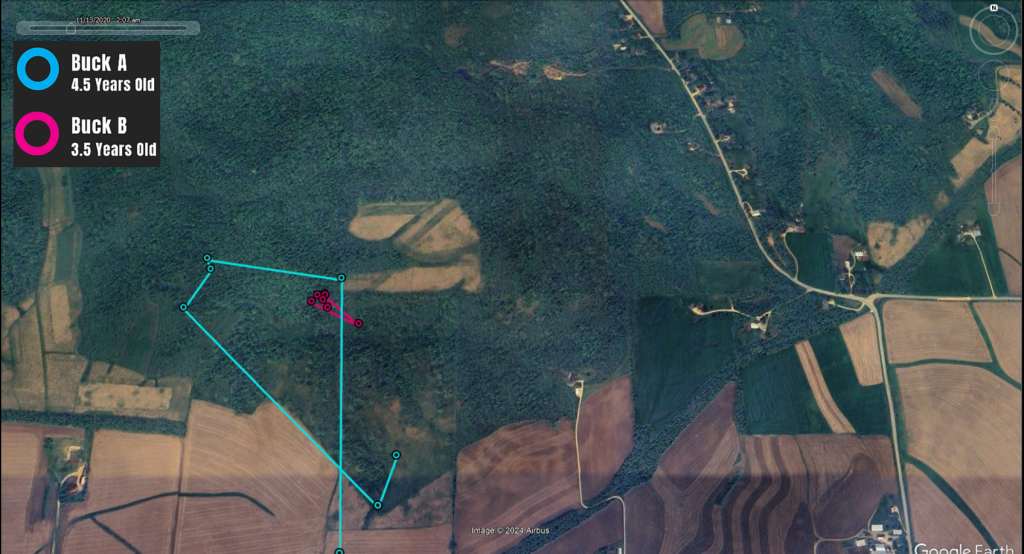
Timestamp 00:39 - 7 a.m. on November 13. After a sequence of smaller steps lengths, Buck A passes once more through Buck B’s cluster of points, for the fourth time in this video. Again, we can't know if these two bucks interacted, but based on how tight Buck B’s points have been over the past 24 hours, it fits the idea that Buck B has been tending and guarding a doe, which would explain why Buck A keeps returning but immediately leaving.
Timestamp 00:44 - Between 11 a.m. – 2 p.m. on November 13, Buck B finally leaves the general area he has been clustered for the past 24 hours, though he doesn’t go far or for long. At 2 p.m. Buck A will return for the last time to that small area near the southwest corner of the field, possibly interacting with Buck B for a fifth time (red circle). After the video ends, both bucks will crisscross the general area around the field but with longer movements and without concentrating in a particular area. The following day Buck B will make a brief trip south to the southern portions of his home range, the first time down there in several days-more on this buck’s seasonal home range in the next article.
Final Thoughts - Buck A vs Buck B
It’s impossible to know exactly what happened during those five interactions within 36 hours in November. Maybe it was filled with drama as two mature bucks struggled for dominance. On the other hand, maybe Buck B was simply taking it easy for a while after an already long and busy rutting season and Buck A just happened to keep passing through a core part of his home range. What we can see though, is that these two bucks would be very familiar with each other at this point. We can also see how taxing the rut would be for a buck. Buck A’s movement hardly changed between day and night, and all that running around would leave little time to rest or forage. Even though Buck B did not move much, it is not hard to imagine this could have been a very busy time for him as well. If Buck B was indeed tending a doe during this period, he likely would have to contend with many more uncollared bucks in addition to Buck A. There could have been a rival buck showing up every hour, which also doesn’t leave much time to rest or forage. It’s little wonder that mature bucks finish the rut in poor physical condition.
CHANGING HOME RANGE BY SEASON: COLLAR 29536 (BUCK B)
Buck B also provides an interesting example of distinct seasonal home ranges. We tracked this buck from March 2020 until November 2021, so the time frame for this video is about two years. A week’s worth of locations is shown at a time. This buck was interesting because he had two distinct areas he used at different times of the year. Buck B was caught in March of 2020 as a 2.75 year old in the northern part of his home range, but shortly after collaring he moved south across a major highway and spent the spring and summer (mid March-September) in this southern area. He then shifted his core area back to the north in the fall and repeated this pattern for both 2020 and 2021. Note that this migratory behavior was not typical of the study’s collared deer. However, it shows the wide variation in movement behavior that can be observed by fitting a lot of deer with GPS collars.
From north to south the main clusters of his locations are spread across approximately 2.5 miles (a relatively long distance for deer in Southern Wisconsin) and encompass a wide variety of habitat types: contiguous forest blocks, small wood lots, agricultural fields, and natural riparian areas. This would be of interest to hunters, or any wildlife watcher enthusiast, as people often wonder where a particular buck went, or where a new one came from.
Perhaps a hunter watched this buck all summer with interest as his antlers developed and began to lay plans for the coming hunting seasons. However, when September arrived his behavior suddenly changed, and he only made unpredictable and infrequent trips back to the area he spent all spring and summer. On the other hand, a hunter in the northern part of Buck B’s home range might have been surprised to see a “new” buck show up on a trail camera suddenly. We have close to two full years of movement data for this Buck B, so we can see this wasn’t a coincidence, as he repeated the same seasonal movement patterns in 2021.
An additional notable feature is the remarkable frequency Buck B crossed HWY 18, a major four-lane highway where deer-vehicle collisions are common. Over the collar’s life, Buck B crossed HWY 18 dozens of times, including a 24 hour period during the 2020 rut when he crossed the highway five separate times. The frequency of road crossings increased during the rut as Buck B moved from one end of his home range to the other, likely to visit different groups of does. This is why deer vehicle collisions are more common in the fall, as buck’s increased movement rate put them at greater risk of collisions as they cross and re-cross busy roads with the excitement and distractions of the rut. Bucks like Buck B might gain an advantage by being able to use habitat on both sides of a busy road, giving them access to more food and mating opportunities, but it comes with higher risk. Buck B’s fate is unknown since his collar broke and fell off in November 2021. The GPS collars for this study were designed to fall off after three years, but within those three years, Buck B and many others were able to further Wisconsin deer and CWD research.
TIP OF THE ICEBERG
The primary objectives of the SW WI CWD Study are to 1) estimate survival and competing sources of mortality for deer in a CWD endemic area and 2) use this data to build an Integrated Population Model (IPM) to determine the deer population’s response to CWD prevalence. However, with the size and scope of this study, many other analyses could be completed using the data collected from the 1,200 animals collared for the study.
Movement ecology data, like what we just covered in this newsletter, is currently being analyzed with some results already published in scientific journals. Dr. Marie Gilbertson, Research Scientist with the Wisconsin Cooperative Wildlife Research Unit, studied how land use shapes deer dispersal patterns. She found that juvenile male deer (64.2%) were most likely to disperse (leave the area where they were born), and while dispersal distances tend to be short, that distance depended on the amount of agricultural land vs forest cover in their birth range. The deer typically avoided agricultural land, quickly moving from forested cover to forested cover and seeking areas near rivers and streams.
But why is movement ecology important to chronic wasting disease research? If we can better understand how deer move across the landscape and use available habitat, we can better predict how and where CWD will spread. We can then adjust surveillance and management efforts more effectively.
The SW WI CWD Study was designed to be one of the largest projects of its kind, both in number of individual animals included in the study and the number of factors being investigated. The power of this research, and the impacts on deer and CWD management, is just getting started. Curious about how many, and what kind, of animals were included? Check out Phase 1: Data Collection and Fieldwork.


